
Search Console Reporting Tools: Check Filters, Exports and Explanations
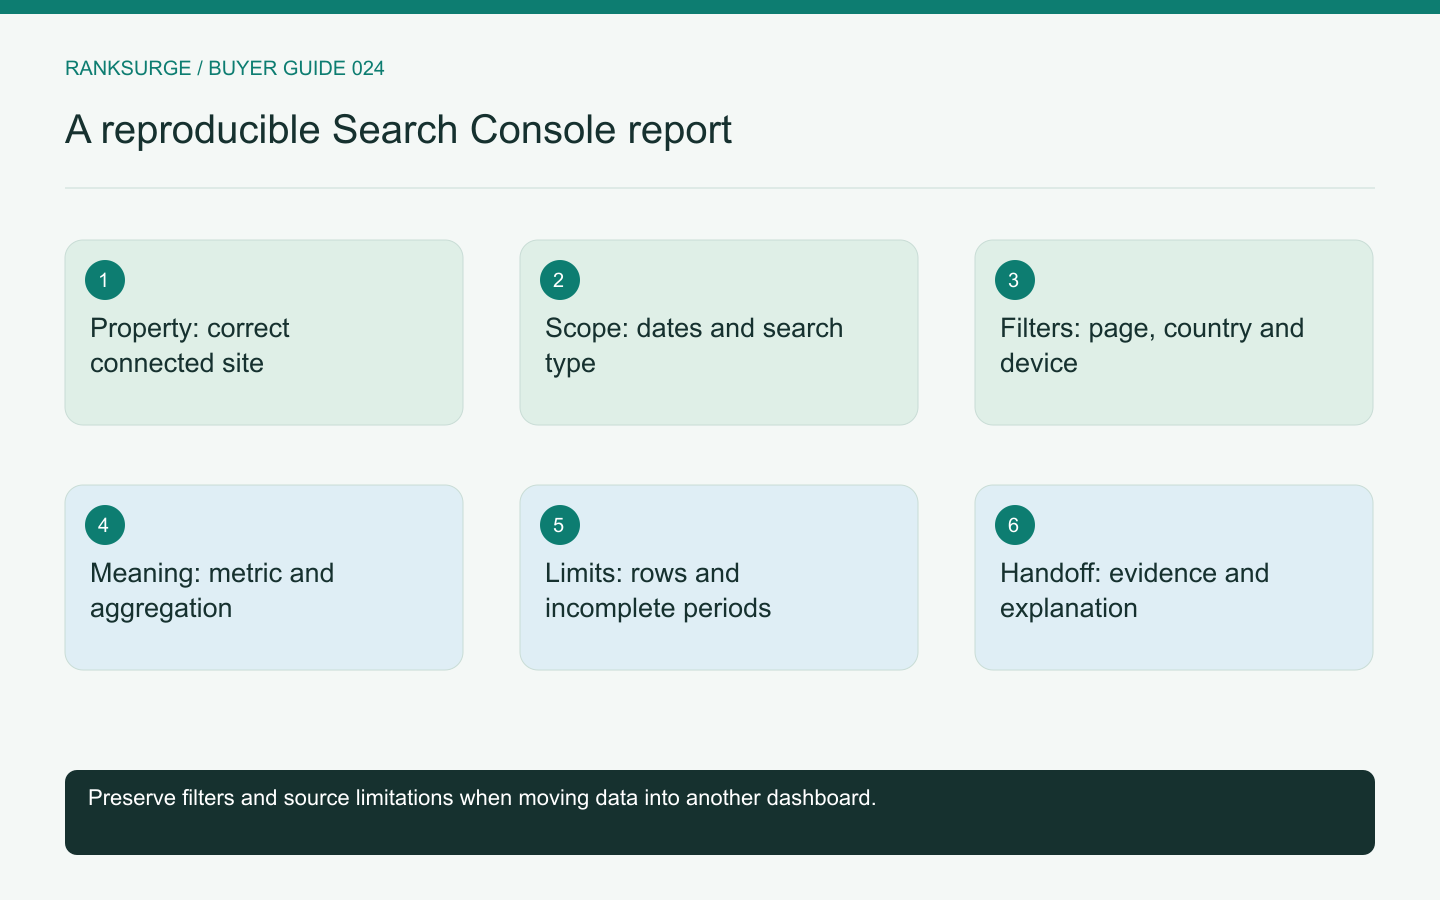
Evaluate Search Console reporting software by reproducing a filtered report, preserving aggregation context and explaining API limitations to readers.
TL;DR
- Pick a reporting tool that preserves Search Console meanings and yields reproducible reports so teammates can reproduce, interpret and challenge findings using the same settings and source context.
- Validate tools by reproducing one concrete Search Console question: define a page group, a completed date range and any filters, then compare the tool's output to the original view.
- Treat exports and dashboards critically: check metric definitions, pagination and freshness, and prefer transparent partial views over confident claims of exhaustiveness.
Begin with a report you can reproduce
A Search Console reporting tool should make first-party search data easier to interpret without changing its meaning. Attractive charts are useful only when the property, date range, filters and aggregation remain clear. Before buying, choose one report in Search Console and ask the candidate tool to reproduce the same question.
Use a defined page group and a completed date range. Record the search type and any country or device filters. Keep the original view as a reference, then inspect differences carefully. A mismatch may reflect a setting or aggregation difference rather than a broken connection.
The trial should end with an explanation a teammate can reproduce.
Check metric definitions before comparing values
Google's Performance report documentation defines clicks, impressions, CTR and average position, and explains that grouping affects the report. A third-party dashboard should preserve those meanings rather than quietly relabel average position as a universal live rank.
Ask which dimensions the tool requests and how it aggregates the result. A page-level table and a property-level total may not be directly interchangeable. If the dashboard calculates a derived metric, request the formula and treatment of missing values.
Keep a small glossary in the report for non-specialist readers. Clear definitions can prevent a misleading conclusion before any sophisticated analysis begins.
Test a filtered page group
Choose a few related pages, such as an integration documentation directory. Compare total performance with the filtered group, then inspect the page and query breakdowns. Verify that the filter matches the intended paths rather than similarly named but unrelated URLs.
Next, change one dimension at a time. Compare devices while keeping the date range and page group constant, or compare periods while preserving the other settings. A tool that makes filters hard to see can encourage accidental mixed comparisons.
Save the configuration with the report. A screenshot without the active filters is insufficient for a recurring analysis someone else will maintain.
Inspect completeness claims
Google's Search Analytics API documentation states that the API does not guarantee every data row and returns top rows within its limits. A reporting product should explain relevant source limitations rather than implying its export is an exhaustive record of every search.
Ask how the tool handles pagination, omitted rows and empty dates. Determine whether a chart uses the same query and aggregation as the table below it. Avoid assuming the sum of visible query rows must equal a broader total.
When completeness is uncertain, label the scope honestly. A useful partial view can still answer a focused question, provided readers know what it represents.
Review date and freshness handling
Confirm which dates the tool requests and whether the newest data is preliminary. A comparison that includes an incomplete recent period can make a decline look larger than it is. Use completed, comparable periods for a basic buying test.
Ask how time zones and scheduled refreshes are documented. The report creation time is different from the latest complete observation period. A dashboard refreshed this morning may still contain data whose collection window has not finished.
If the tool supports automated reports, inspect the behavior when the source has not yet supplied expected data. A truthful incomplete report is preferable to a confident explanation built on missing observations.
Test explanations, not only charts
Give the report a specific question: why did clicks change for this page group? Ask the tool or analyst workflow to separate observations from hypotheses. A change in impressions, CTR or query mix can suggest different investigations, but the report should not invent a causal explanation.
Require links or tables supporting the main conclusion. A non-specialist should be able to see what changed, what might explain it and what evidence is needed next. Generic advice to improve content is not a complete interpretation.
RankSurge's MCP documentation describes access to Search Console performance. Evaluate the returned data and report behavior directly rather than assuming an agent summary automatically preserves every filter and limitation.
Related reading: The Dark Query Problem: Why Search Console Hides Most of Your Searches.
Related reading: The Best Open Source SEO Tools in 2026.
Check sharing and access boundaries
Determine which property access the connection requires and who can view the resulting reports. A client or colleague may need one report without broader access to all connected properties. Test the intended sharing method with harmless data or an appropriate account.
Export a sample and verify that dates, filters and metric definitions remain understandable. If the tool's visual report is clear but the export loses context, document the additional handoff work required.
Keep authorization management separate from reporting convenience. The account that connects a property should be owned and maintained by the organization according to its access policy.
Buy a clearer interpretation of the source
Choose software that reduces reporting work while preserving the source's meaning and limitations. The acceptance condition is a report that another person can reproduce, interpret and challenge with the same settings.
A useful tool does not need to hide every discrepancy. It should help explain discrepancies that matter and identify those requiring further investigation. That transparency makes the report a dependable basis for decisions rather than a polished substitute for understanding the data.